Measure what your GRC platform actually delivers.
Comprehensive multi-source value assessment drawing on seven independent evidence streams from internal assessments through to tool deep-dives so you know whether the platform is delivering what was promised. Triangulated, not anecdotal.
GRC platforms rarely deliver what was promised.
Every board-approved GRC investment gets justified with a business case. Twelve months post go-live, almost nobody goes back to check. The evidence for value delivery is usually anecdotal, single-source, and written by the people accountable for it.
Average enterprise GRC spend, unmeasured
A typical enterprise GRC implementation runs past two million AUD over five years between licences, implementation, and internal effort. Almost no organisation rigorously measures whether that spend is paying back.
Evidence source, in most "assessments"
Most post-implementation reviews rely on a single source of evidence usually a user survey or an internal self-assessment. That's not triangulation. That's an opinion piece with charts.
Confidence weighting on the output
Even when multiple sources are used, findings are typically reported with equal weight regardless of sample size, respondent bias, or data quality. The confidence of the conclusion is invisible.
Six capabilities, seven evidence streams.
Value Optimisation is the flagship deep-assessment module. It's what happens when "is this actually delivering?" becomes a question the board is asking and a spreadsheet isn't enough.
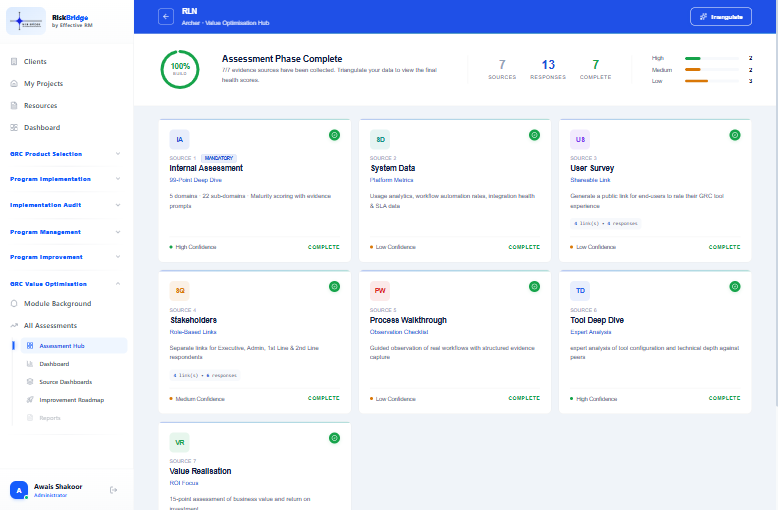
Seven evidence sources, one assessment
Internal assessment, system data, user survey, stakeholder interviews, process walkthroughs, tool deep-dive, value realisation tracking. Triangulated insight, not a single perspective dressed up as a finding.
Confidence-weighted scoring
Each source contributes a confidence modifier of ±10% (up to ±40% total). When evidence is thin small sample, low response rate, missing documents the confidence visibly reflects it.
Value leakage identification
Specific, prioritised actions with expected value recovery not generic recommendations. If module X is underused by BU-2, that's quantified and costed, not buried in an executive summary.
Multi-respondent triangulation
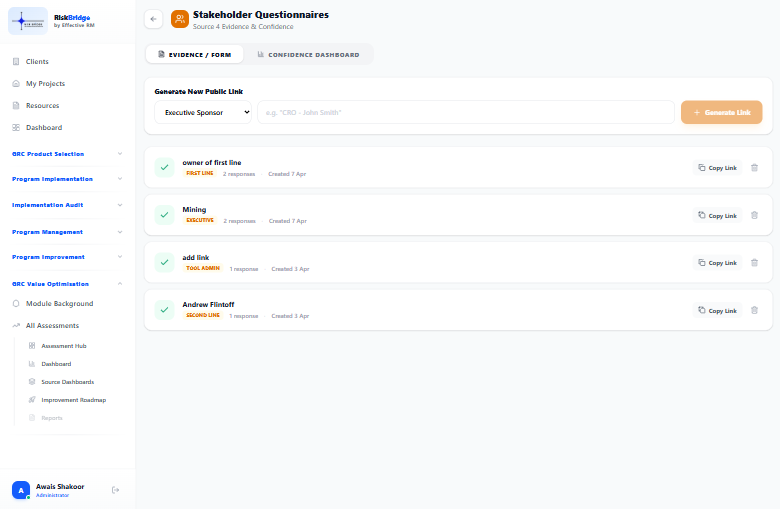
Stakeholder questionnaires, user surveys, and process walkthroughs each capture median, standard deviation, and named outliers. Alignment is visible; disagreement gets surfaced rather than averaged away.
Board-ready reporting
Verbal ratings for senior audiences "Strong", "Respondents broadly agree" not raw scores and standard deviations. The numbers sit underneath, accessible on demand, never in the way.
Benchmarking against spend
Value score compared against your actual cost band, licence band, and timeline not an abstract maturity curve. The question "is this worth it?" gets a defensible answer.
Four phases, seven evidence sources.
Value Optimisation is a structured engagement, typically delivered over four to six weeks. Each phase produces a defensible artefact and every finding traces back to the evidence source that generated it.
Collect
Run all seven sources internal assessment, system data pull, user survey, stakeholder interviews, process walkthroughs, tool deep-dive, value realisation.
Triangulate
Cross-reference findings across sources. Where sources agree, confidence rises. Where they disagree, the divergence is named and investigated not averaged away.
Score
Each evidence stream contributes up to ±10% confidence modifier (±40% total). The overall value score and verbal rating are calculated with confidence baked in.
Recommend
Prioritised value recovery plan. Each action scoped with indicative effort and expected value recovery. Board-ready output with verbal ratings for senior audiences.
What you actually see in the platform.
High-fidelity views of the value optimisation module. Every data point is interactive, traceable, and calibrated for senior decision-makers.
One source, fully expanded.
Click any of the seven evidence streams to see the underlying respondents, their scores, the median, the standard deviation, and the named outliers. Disagreement gets surfaced not averaged away into a misleadingly tidy number.
- Median, standard deviation, and named outliers per question
- Role- and seniority-tagged responses for context
- Source weight visible and adjustable with rationale
Specific actions with expected $ recovery.
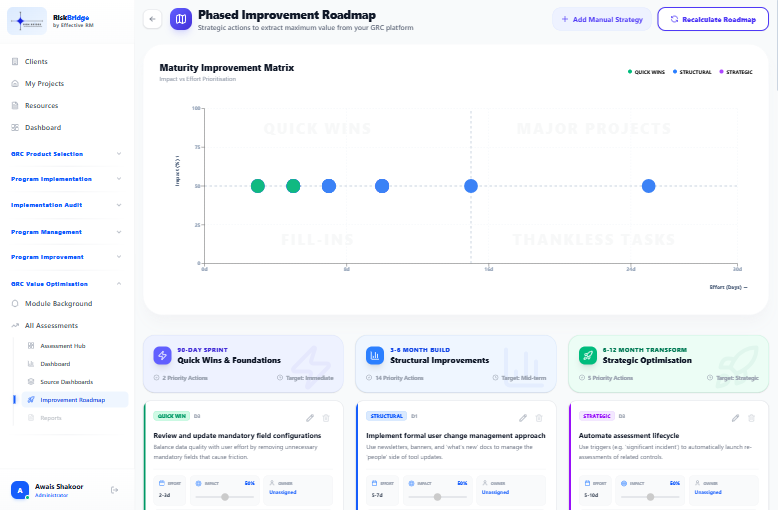
Not a generic "improve training" recommendation. Prioritised actions with quantified value recovery each traced to the evidence source that surfaced it, ready to sequence into a board-approved investment plan.
- Each action scoped with indicative effort and expected recovery
- Full traceability back to the evidence source that generated it
- Priority ranking based on value recovery vs implementation effort
Seven evidence streams in, one board pack out.
Value Optimisation reads from seven independent evidence sources and produces board-ready artefacts calibrated for senior audiences. Raw data sits underneath, available on demand.
Seven Evidence Sources
Outputs & Exports
Some of the functionality is in the future iteration - contact us for details or view our pricing.
The PE investors kept asking the same question: is this investment actually paying back? Value Optimisation gave us something real to take back to the board seven independent sources and $840K of quantified recovery actions.
From assessment to executed recovery.
Value Optimisation produces the evidence. These modules are where the findings get acted on whether you need ongoing tracking or a platform replacement.
Scale and Enterprise tiers only.
Value Optimisation is a comprehensive deep-assessment engagement, typically delivered across four to six weeks. For a lighter entry point, see Module 05 Health Check.
Find out with evidence not opinions.
Seven independent sources. Confidence-weighted scoring. Quantified value recovery. Defend your GRC investment with the data it deserves.
Evidence behind Value Optimisation
Does ERM Maturity Really Pay Off? How to Measure Your Own Program's ROI
Research from RIMS demonstrates that organizations with mature enterprise risk management realize a valuation premium of up to 25%. However, proving that return for your own organization requires a multi-source evidence approach.
Everyone Claims COSO ERM Alignment — Here's How to Tell Who Actually Has It
COSO ERM Integrating with Strategy and Performance connects risk directly with strategic goals. Most GRC vendors reference COSO in marketing, but few platforms structurally support its 20 principles.
Why Most Digital Risk Transformations Stall Before They Start
McKinsey & Company research demonstrates that digital risk transformations fail primarily due to lack of upfront strategic alignment and fear of regulatory transparency. Fixed-scope models eliminate this barrier.